TUBEPLOT Creates a Tubeplot
Section: Handle-Based Graphics
Usage
Thistubeplot function is from the tubeplot package
written by Anders Sandberg. The simplest syntax for the
tubeplot routine is
tubeplot(x,y,z)
plots the basic tube with radius 1, where x,y,z are
vectors that describe the tube. If the radius of the
tube is to be varied, use the second form
tubeplot(x,y,z,r)
which plots the basic tube with variable radius r (either a vector or a scalar value). The third form allows you to specify the coloring using a vector of values:
tubeplot(x,y,z,r,v)
where the coloring is now dependent on the values in the
vector v. If you want to create a tube plot with
a greater degree of tangential subdivisions (i.e.,
the tube is more circular, use the form
tubeplot(x,y,z,r,v,s)
where s is the number of tangential subdivisions (default is 6)
You can also use tubeplot to calculate matrices to feed to mesh
and surf.
[X,Y,Z]=tubeplot(x,y,z)
returns N x 3 matrices suitable for mesh or surf.
Note that the tube may pinch at points where the normal and binormal
misbehaves. It is suitable for general space curves, not ones that
contain straight sections. Normally the tube is calculated using the
Frenet frame, making the tube minimally twisted except at inflexion points.
To deal with this problem there is an alternative frame:
tubeplot(x,y,z,r,v,s,vec)
calculates the tube by setting the normal to the cross product of the tangent and the vector vec. If it is chosen so that it is always far from the tangent vector the frame will not twist unduly.
Example
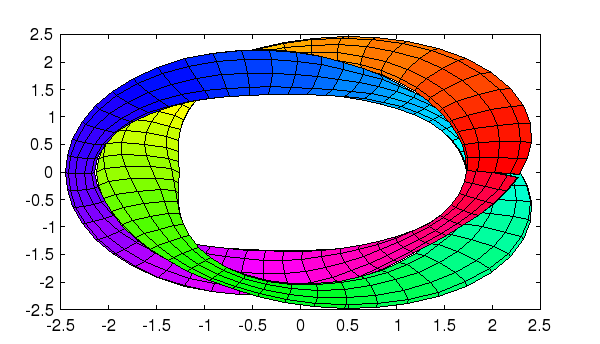
Here is an example of atubeplot.
--> t=0:(2*pi/100):(2*pi);
--> x=cos(t*2).*(2+sin(t*3)*.3);
--> y=sin(t*2).*(2+sin(t*3)*.3);
--> z=cos(t*3)*.3;
--> tubeplot(x,y,z,0.14*sin(t*5)+.29,t,10);

Written by Anders Sandberg, asa@nada.kth.se, 2005 Website says the package is free for anybody to use. www.nada.kth.se/~asa/Ray/Tubeplot/tubeplot.html
