TEXT Add Text Label to Plot
Section: Handle-Based Graphics
Usage
Adds a text label to the currently active plot. The general syntax for it is use is eithertext(x,y,'label')
where x and y are both vectors of the same length, in which
case the text 'label' is added to the current plot at each of the
coordinates x(i),y(i) (using the current axis to map these to screen
coordinates). The second form supplies a cell-array of strings
as the second argument, and allows you to place many labels simultaneously
text(x,y,{'label1','label2',....})
where the number of elements in the cell array must match the size of
vectors x and y. You can also specify properties for the labels
via
handles = text(x,y,{labels},properties...)
Example
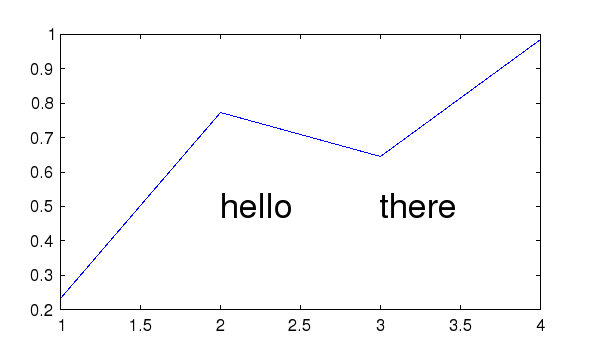
Here is an example of a few labels being added to a random plot:
--> plot(rand(1,4))
--> text([2,3],[0.5,0.5],{'hello','there'})

Here is the same example, but with larger labels:
--> plot(rand(1,4))
--> text([2,3],[0.5,0.5],{'hello','there'},'fontsize',20)

