PATCH Patch Graphics Function
Section: Handle-Based Graphics
Usage
This routine is used to create a patch object that can be plotting 2D and 3D surfaces. A patch is a polygon defined by the xyz coordinates of its vertices and optionally by the color at the vertices. There are several forms for thepatch function:
  h = patch(X,Y,C,properties...)
  h = patch(X,Y,Z,C,properties...)
  h = patch(properties...)
  h = patch(V)
Where X, Y and Z are matrices or vectors of x, y or z coordinates
and C is a matrix or vector of color values (the colormap
for the current fig is applied).
Example
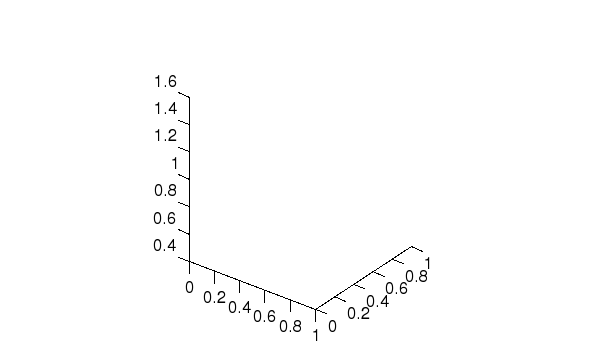
Here we generate a surface specifying all four components.--> x = [ 0 1 0 1]; --> y = [ 0 0 1 1]; --> c = [ 1 1 1 ]; --> patch(x,y,c) --> axis equal --> view(3) Warning: Newly defined variable xlim shadows a function of the same name. Use clear xlim to recover access to the function Warning: Newly defined variable ylim shadows a function of the same name. Use clear ylim to recover access to the function Warning: Newly defined variable zlim shadows a function of the same name. Use clear zlim to recover access to the function

