LOGLOG Log-Log Plot Function
Section: Handle-Based Graphics
Usage
This command has the exact same syntax as theplot command:
loglog(<data 1>,{linespec 1},<data 2>,{linespec 2}...,properties...)
in fact, it is a simple wrapper around plot that sets the
x and y axis to have a logarithmic scale.
Example
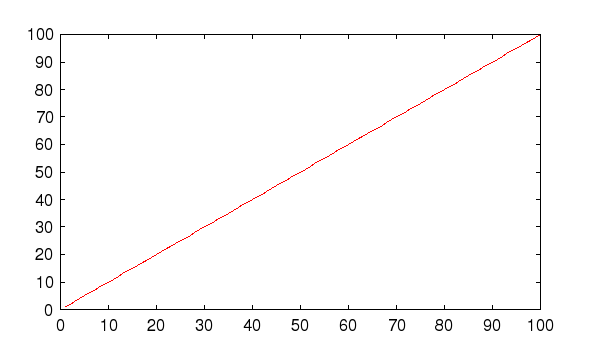
Here is an example of a doubly exponential signal plotted first on a linear plot:--> x = linspace(1,100); --> y = x; --> plot(x,y,'r-');
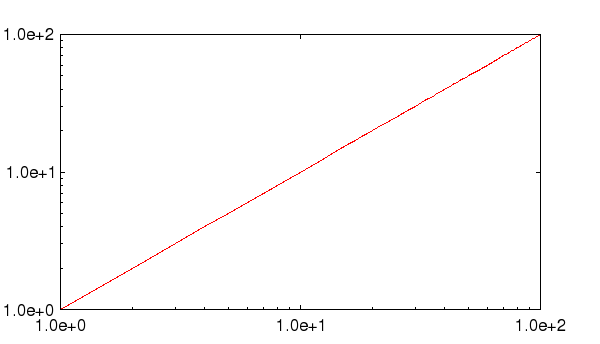
and now on a log-log plot
--> loglog(x,y,'r-');