CONTOUR Contour Plot Function
Section: Handle-Based Graphics
Usage
This command generates contour plots. There are several syntaxes for the command. The simplest iscontour(Z)
which generates a contour plot of the data in matrix Z, and will
automatically select the contour levels. The x,y coordinates of the
contour default to 1:n and 1:m, where n is the number of
columns and m is the number of rows in the Z matrix. Alternately,
you can specify a scalar n
contour(Z,n)
which indicates that you want n contour levels. For more control,
you can provide a vector v containing the levels to contour. If you
want to generate a contour for a particular level, you must pass a
vector [t,t] where t is the level you want to contour. If you
have data that lies on a particular X,Y grid, you can pass either
vectors x,y or matrices X,Y to the contour function via
  contour(X,Y,Z)
  contour(X,Y,Z,n)
  contour(X,Y,Z,v)
Each form of contour can optionally take a line spec to indicate the
color and linestyle of the contours to draw:
contour(...,linespec)
or any of the other forms of contour. Furthermore, you can supply an
axis to target the contour plot to (so that it does not get added to
the current axis, which is the default):
contour(axis_handle,...)
Finally, the contour command returns a handle to the newly returned
contour plot.
handle = contour(...)
To place labels on the contour plot, use the clabel function.
Example
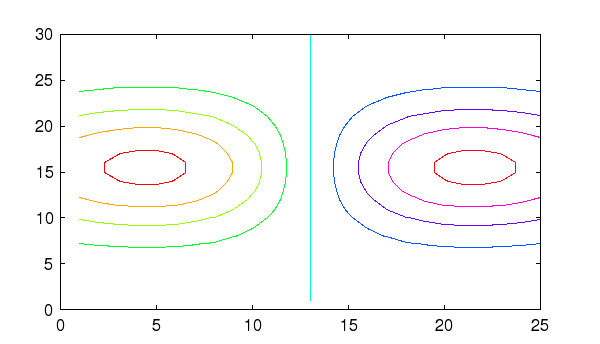
Here is a simple example of a contour plot with the defaultx,y
coordinates:
--> [x,y] = meshgrid(linspace(-1,1,25),linspace(-2,2,30));
--> z = x.*exp(-x.^2-y.^2);
--> contour(z)
which results in the following plot

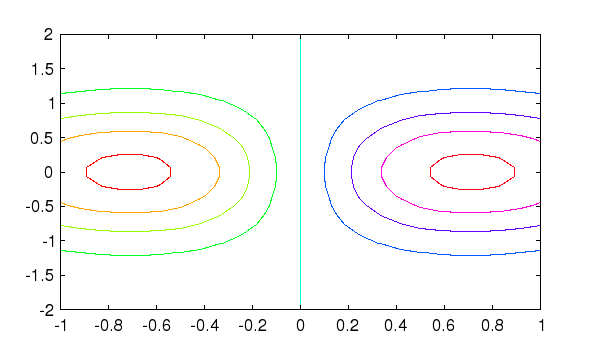
Here, we specify the x and y coordinates explictly
--> contour(x,y,z)
note that the axis limits have changed appropriately

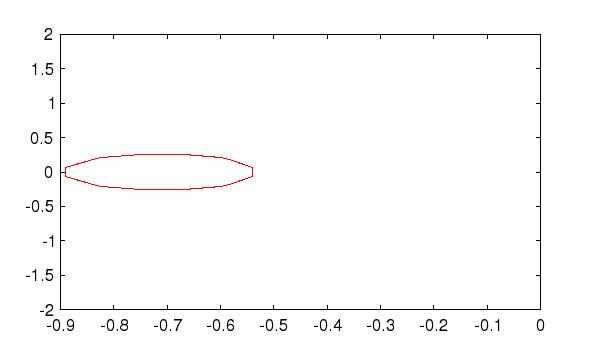
By default, contours are created at values selected by FreeMat. To provide our own set of contour values (asymmetrically about zero in this case), we supply them as
--> contour(x,y,z,[-.4,0.,3])
which is here

Also be default, contour uses the current color map and clim
limits to determine the coloring of the contours. Here, we override the
color spec so that we have all black contour
--> contour(x,y,z,'b-')
Warning: Newly defined variable nargin shadows a function of the same name.  Use clear nargin to recover access to the function
which is here

