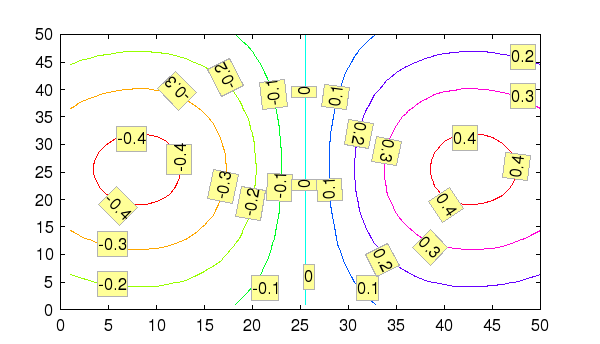
CLABEL Add Labels To Contour Plot
Section: Handle-Based Graphics
Usage
Theclabel function adds labels to a contour plot
Generate contour labels for a contour plot. The syntax
for its use is either:
handles = clabel(contourhandle,property,value,property,value,...)
which labels all of the contours in the plot, or
handles = clabel(contourhandle,vals,property,value,property,value,...)
which only labels those contours indicated by the vector vals.
The contourhandle must be the handle to a contour plot object.
The remaining property/value pairs are passed to the text function
to control the parameters of the generated text labels. See the
text properties for the details on what can be used in those labels.
Example
--> [x,y] = meshgrid(linspace(-1,1,50));
--> z = x.*exp(-(x.^2+y.^2));
--> h = contour(z);
--> clabel(h,'backgroundcolor',[1,1,.6],'edgecolor',[.7,.7,.7]);
which results in

Alternately, we can just label a subset of the contours
--> h = contour(z);
--> clabel(h,[-.2,0,.3]);
which results in

