TITLE Plot Title Function
Section: Handle-Based Graphics
Usage
This command adds a title to the plot. The general syntax for its use is
title('label')
or in the alternate form
title 'label'
or simply
title label
Here label is a string variable. You can also specify
properties for the label, and a handle to serve as a target
for the operation
title(handle,'label',properties...)
Example
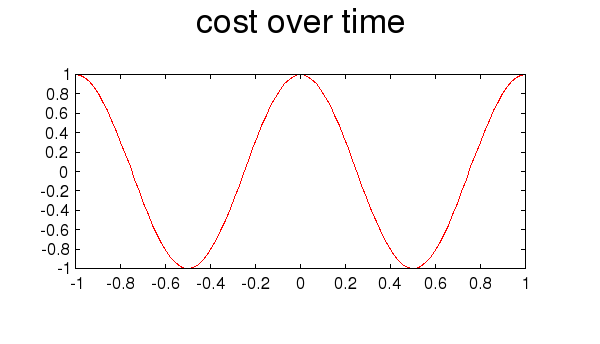
Here is an example of a simple plot with a title.
--> x = linspace(-1,1);
--> y = cos(2*pi*x);
--> plot(x,y,'r-');
--> title('cost over time');
Warning: Newly defined variable nargin shadows a function of the same name.  Use clear nargin to recover access to the function
which results in the following plot.

We now increase the size of the font using the properties
of the label
--> title('cost over time','fontsize',20);
Warning: Newly defined variable nargin shadows a function of the same name.  Use clear nargin to recover access to the function